Statistics
Overview
Teaching: min
Exercises: minQuestions
Basics
Dataset: Any group of values retrieved through a common method/procedure of collection.
Weighted Mean: Weighted mean of a group of numbers with weights given in percentages and scores given in the same range is given by:

Note: Always question about how the weights and categories were collected and why and to what extent it holds importance.
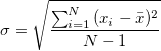
Standard Deviation: A quantity expressing by how much the members of a group differ from the mean value for the group. In more formal terms, it’s the average distance between a datapoint and the mean of the dataset and is given by the equation:
z-score: The z-score is the distance in standard deviation units for any given observation:

Empirical Rule or Three-Sigma Rule: Most of the data points fall within three standard deviations, with 68% would lie within 1 sd, 95% within 2 sd and 99.7% would fall within 3 sd.
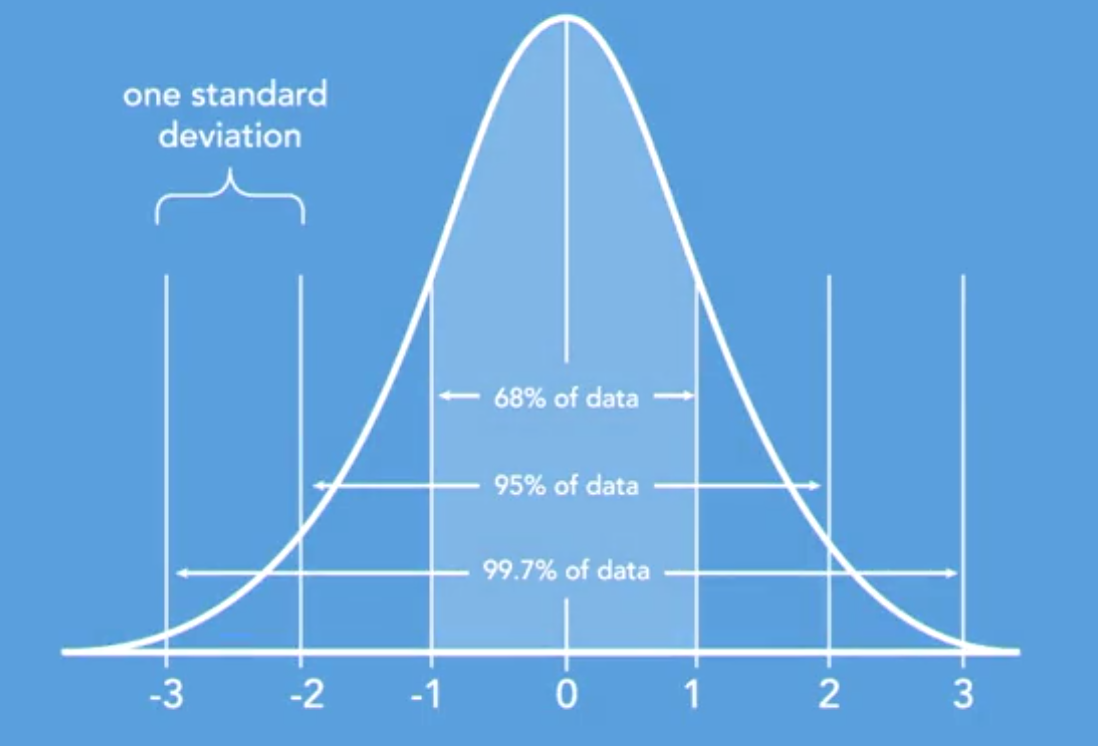
Note: It only works for symmetrically distributed data
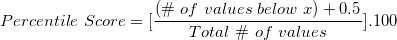
Percentile Score: The percentile score for any value x in the dataset is given by:
Probabilities
Event: An event is a set of probabilities e.g. When rolling a dice, an event A = (4,2,6) represents the event that an even number will appear.
Sample Space: All possible outcomes for a particular random experiment constitute it’s sample space.
Probability: The number of favorable outcomes divided by the number of all possible outcomes in a given situation.
Types of Probabilities
-
Classical Probability: The flipping of a coin is an example of classical probability because it is known that there are two sides to it and the likelihood of any one of them turning up is 50%. Objective Probabilities are based on calculations and classical probability is a type of Objective Probability.
-
Empirical Probability: The probabilities are the ones that are based on previously known data. For instance, Messi scoring more than ten goals in this season of FIFA is an example of Empirical probability because it is calculated on the basis of Messi’s previous record. This too is an example of Objective Probability since it’s also based on calculations.
-
Subjective Probability: These probabilities are not based on mathematical calculations and people use their opinions, their experiences to assert their viewpoints with some amount of relevant data that makes their own point stronger.
Addition Rule: The addition rule in probabilities is a rule that ensures that an event is not counted twice when calculating probabilities (where P(overlap) is the probability of both E1 and E2 occurring:

Conditional Probability: The probability of occurrence of an event given that some other event has already occurred.
Independent Events: If the probability of two events are completely unrelated. If we can prove that the probability of two occurring together is equal to the product of their individual probabilities, then we can say that the two events are independent.
Random Variable: The result of an experiment that has random outcomes is called a random variable. They can be of two types:
- Discrete RV: The number of drinks a person will order at Tank is an example of discrete random variable because it has to be a whole number.
- Continuous RV: The waiting time in line before one can order at a Burger King is an example of continuous variable because there are no fixed values that could be outcomes. The possibilities are infinite and continuous.
- Binomial RV: When an event has only two possible outcomes, the result is called a Binomial Random Variable.
Probability Density: The curves that represent the distribution of probabilities are called Probability Density curves.
Sampling
There are a few conditions that need to be considered before sampling is done from various sources:
- Size to Cost ratio: The appropriate size of the sample based upon the cost per data point in the sample
- Inherent Bias: If any bias was knowingly/unknowingly introduced while creating the sample, it will need to be considered!
- Quality of Sample
A simple random sample is the gold standard when collecting samples. This means, that any given point during the sample selection process, any individual has the same probability of being chosen as any other individual.
Some alternative sampling methods are:
- kth point: The first data point is selected and then every kth data point is selected in this method.
- Opportunity Sampling: The first n values are selected from the total data.
- Stratified Sampling: The whole sample is broken out into homogenous groups. Then we select few samples from each strata.
- Cluster Sampling: The whole sample is collected from heterogenous groups with data points with different characteristics. Then we select few samples from each group.
Confidence Intervals
As the name suggests, the confidence intervals present a level of confidence for a given interval.
Hypothesis Testing
The process to be able to test a hypothesis that has been presented.
Visualization Tips
- Tables: Useful for detailed recording and sharing of actual data
- Frequency Table: Displays the frequency of each observation in the data set
- Dot Plots: When you want to convey information that is discrete and individual to each observation.
- Histograms: When you want to convey frequencies of grouped bins, this could be useful.
- Pie Charts: Relative Frequency distributions are best represented with Pie Charts. They are also useful for representing distributions among qualitative variables where histograms wouldn’t be a very good measure.
Key Points